
 Reports & Analytics
Your Dashboard
The Dashboard at /dashboard shows KPI cards for Inbox, Pending, Cove AI, Quality, Escalations, Help Center, Changelog, Roadmap, Scheduling, and Revenue, plus a My Queue panel. Cards are draggable, order persists locally, and some cards are gated by role.
The Dashboard is the home screen of Convot, found at /dashboard. It gives you a live health check of your entire support operation without going into any individual report. All org members can reach the dashboard, but which cards are visible depends on your role.
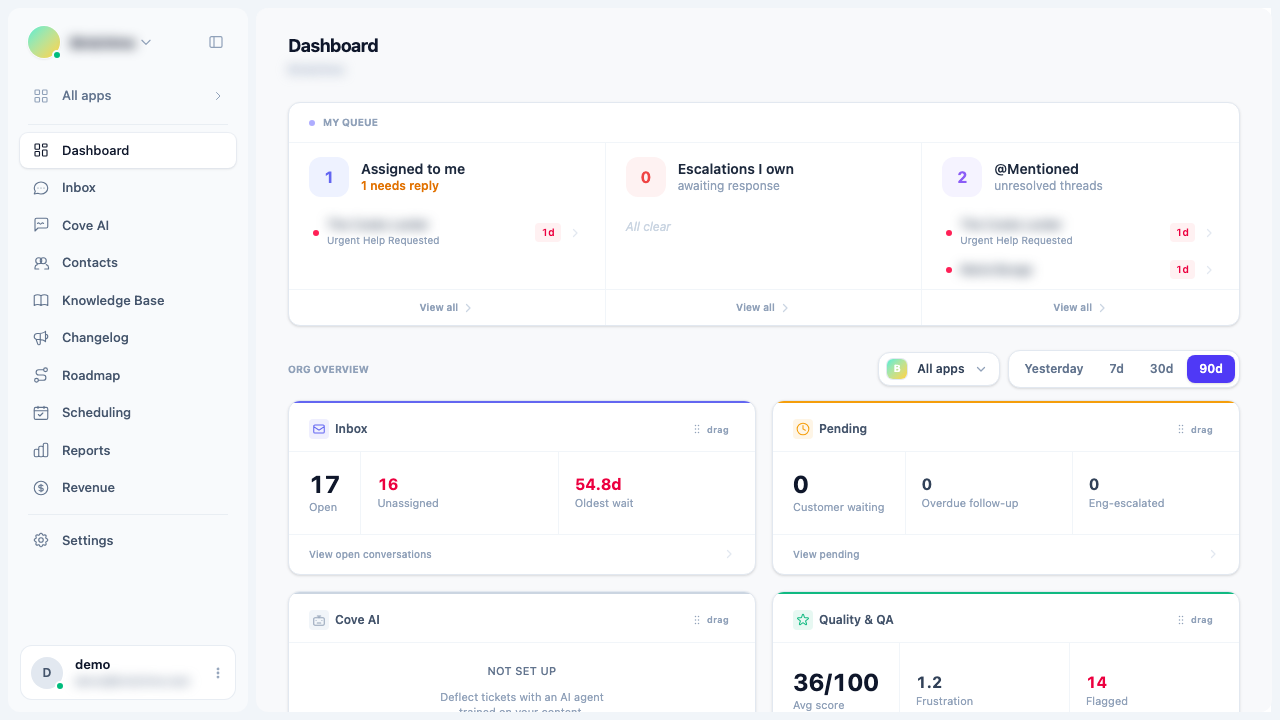
My Queue
At the top of the dashboard, the My Queue panel is personal - it shows only what is relevant to the logged-in agent or admin. It has three columns:
| Column | What it shows |
|---|---|
| Assigned to me | Open conversations currently assigned to you, with a count of how many need a reply |
| Escalations I own | Engineering escalations where you are listed as the owner, currently awaiting response |
| @Mentioned | Conversations where you have been @mentioned that are still unresolved |
Each column lists up to the most recent conversations in that bucket. Each row shows the customer name, the conversation subject, and a time badge showing how long the conversation has been waiting. Time badges turn amber at 4 hours and red when the conversation is at risk.
The “needs reply” count in “Assigned to me” turns amber when customers are waiting on you. Click any conversation to open it directly in the inbox. Click “View all” at the bottom of each column to go to the filtered list.
My Queue is visible to all org members (agents and admins alike).
Org overview - KPI cards
Below My Queue is the “Org overview” section. This is a grid of KPI cards - one card per feature area. Cards are visible based on your role (see below).
You can filter the Org overview by app (use the app picker dropdown, top right of the section) and by date range (Yesterday, 7d, 30d, 90d).
Inbox card
Tracks your open conversation queue right now.
| Stat | Description |
|---|---|
| Open | Conversations currently in an open state |
| Unassigned | Open conversations with no assigned agent - turns red when any are unassigned |
| Oldest wait | How long the longest-waiting open conversation has been open - turns red above 48 hours |
Pending card
Tracks conversations waiting on a response or follow-up.
| Stat | Description |
|---|---|
| Customer waiting | Conversations in “pending” status where the customer has not yet received a resolution |
| Overdue follow-up | Pending conversations whose follow-up deadline has passed - turns red when any exist |
| Eng-escalated | Conversations with an active engineering escalation |
Cove AI card
Summary of your AI agent’s performance over the selected period.
| Stat | Description |
|---|---|
| Deflection | Percentage of handled conversations resolved by the bot without escalating - shown with a period-over-period change badge |
| CSAT | Percentage of customer feedback responses rated as helpful |
| Cost | Total bot spend in USD for the period |
If Cove AI has not been set up yet, the card shows a “Not set up” state with a link to configure it.
Quality and QA card
Summary of AI-graded conversation quality for the period.
| Stat | Description |
|---|---|
| Avg score | Average quality score across all graded conversations (0-100) |
| Frustration | Average frustration level across all graded conversations - turns red above 1.5 |
| Flagged | Number of conversations graded “bad” - turns red when any are flagged |
Click “View quality report” to go to the Quality (AI) report.
Escalations card
A snapshot of open engineering escalations.
| Stat | Description |
|---|---|
| Open | Engineering escalations currently open |
| SLA breached | Open escalations that have exceeded their SLA deadline - turns red when any exist |
| Median turnaround | Median time from escalation created to resolved, for escalations closed in the period |
Click “View escalation scorecard” to go to the Support health report.
Help Center card
Engagement with your published help articles.
| Stat | Description |
|---|---|
| Article views | Total article views in the period |
| Zero-result searches | Searches that returned no articles - turns red above 10, indicating missing content |
| Feedback score | Percentage of article feedback responses marked helpful |
If no help center has been created yet, the card shows a “Not set up” state.
Changelog card
Engagement with your product updates.
| Stat | Description |
|---|---|
| Views | Total changelog entry views in the period |
| Widget opens | Times a changelog entry card was opened in the in-app widget |
| Top entry | Title of the most-viewed changelog entry in the period |
Roadmap card
Demand signals from your public feature board.
| Stat | Description |
|---|---|
| Total votes | Votes cast on roadmap items in the period |
| New submissions | New roadmap items submitted in the period |
| Top item | Title of the roadmap item with the most votes (all-time) |
Scheduling card
Booking activity across your org.
| Stat | Description |
|---|---|
| Upcoming bookings | Confirmed and rescheduled bookings with a future start time (live, not date-scoped) |
| Cancellation rate | Cancelled bookings as a percentage of total in the period - turns red above 20% |
| Top meeting type | Name of the most-booked meeting type in the period |
Revenue card
Shopify MRR data, if Shopify is connected.
| Stat | Description |
|---|---|
| Gross MRR | Gross monthly recurring revenue from active subscriptions - with period-over-period change |
| Net MRR | Net MRR after refunds and discounts |
| Churned | Number of subscribers who churned in the period |
The Revenue card is only visible to members who have been granted the revenue permission. By default, only the organization’s super-owner (the account creator) sees this card. Owners and admins with the revenue permission also see it.
Dragging cards to reorder
Every KPI card has a “drag” handle in its top-right corner. Drag cards to rearrange the grid in any order that makes sense for how you work. Your order is saved automatically in browser local storage - it persists across page reloads and browser restarts on the same device.
If your role changes and a card becomes visible that was not there before, it is added to the end of your saved order. If a card becomes invisible (e.g. revenue permission removed), it is removed from the grid but your saved positions for the remaining cards are preserved.
Role-based visibility
| Card | Who sees it |
|---|---|
| Inbox | All members (agents and admins) |
| Pending | All members |
| Cove AI | Admins and owners only (requires reports permission) |
| Quality and QA | Admins and owners only |
| Escalations | Admins and owners only |
| Help Center | Admins and owners only |
| Changelog | Admins and owners only |
| Roadmap | Admins and owners only |
| Scheduling | Admins and owners only |
| Revenue | Members with the revenue permission only |
Agents see My Queue plus Inbox and Pending. All other cards require the reports permission.
Agents who navigate directly to /dashboard will see My Queue, Inbox, and Pending, but not the Org overview KPI cards. This is by design - detailed metrics are reserved for owners and admins.
Was this article helpful?
Thanks for your feedback!