
 Reports & Analytics
AI Quality Report
The Quality (AI) tab shows graded conversation counts, average score, good/bad/borderline breakdown, flagged conversations with issue tags, quality trend over time, per-agent scores, and a topic table with bad-rate per topic.
The Quality (AI) tab is at Reports - Quality (AI). Every conversation your team handles can be automatically graded by Cove AI using a 0-100 scale. This tab surfaces the grades, flags the worst conversations, and breaks quality down by agent and topic.
Quality grading requires AI Auto-QA to be enabled. If you see “No graded conversations in range yet”, go to Settings - Reports to turn on Auto-QA.
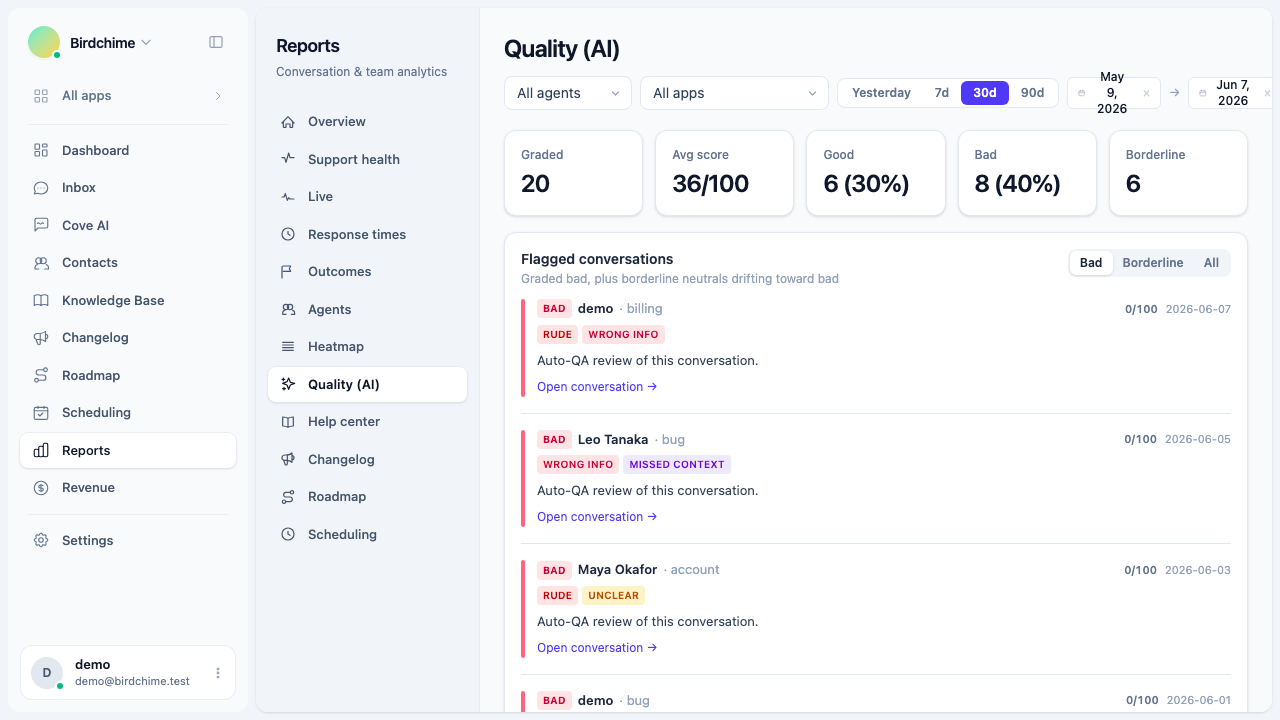
The five headline stats
| Stat | What it measures |
|---|---|
| Graded | Total conversations graded by the AI in the period |
| Avg score | Mean quality score across all graded conversations (0-100) |
| Good | Count and percentage of conversations graded “good” |
| Bad | Count and percentage of conversations graded “bad” |
| Borderline | Count of “neutral” conversations whose score falls below the borderline threshold (quietly drifting toward bad) |
Scores are assigned per conversation by period date (the day the conversation was assessed, in your org’s time zone).
Flagged conversations
The “Flagged conversations” card is the most actionable part of this tab. It lists conversations graded bad, plus borderline neutrals that are close to bad but not quite there.
Three filter tabs let you narrow the list:
- Bad - conversations explicitly graded “bad” (default view)
- Borderline - “neutral” conversations whose score is below the borderline threshold
- All - both bad and borderline
Each flagged conversation shows:
- A colored left border (red = bad, amber = borderline)
- The grade badge (“Bad” or “Borderline”)
- The agent’s name
- The conversation topic (AI-generated)
- The score out of 100
- The date of assessment
- Issue tags (see below)
- A plain-English summary of what went wrong
- A quoted excerpt from the conversation as evidence
- A direct link to open the conversation in the inbox
The list shows 5 conversations at a time, sorted by lowest score first. Click Load more to fetch the next page.
Issue tags
Each bad or borderline conversation can carry one or more issue tags. These are set by the AI grader to identify the specific failure mode:
| Tag | Meaning |
|---|---|
| Rude | Agent used language that was impolite or disrespectful |
| Dismissive | Agent brushed off the customer’s concern without engaging with it |
| Wrong info | Agent gave incorrect information |
| Unclear | Agent’s response was hard to understand or ambiguous |
| Ignored question | Agent did not address a question the customer asked |
| Missed context | Agent missed relevant information available in the conversation |
| Long delay | Agent took an unusually long time to respond |
| No follow-up | Agent promised to follow up but did not |
| Overpromised | Agent committed to something that was not delivered |
| Abandoned | The conversation was left without resolution |
A conversation can have multiple issue tags if more than one failure mode occurred.
Quality over time
A stacked area chart shows the daily mix of good, neutral, and bad grades across the period. This makes it easy to spot degradations - if the “bad” band suddenly thickens on a particular day, something changed.
By agent
The “By agent” section shows two things side by side:
- A score list - each agent’s name and their average quality score for the period, colored from green (high) to red (low).
- A stacked bar chart - each agent’s conversation count broken into good, neutral, and bad segments.
If an agent has fewer than 5 graded conversations in the period, a warning badge appears next to their score. A score based on a small sample is less reliable.
Topics
The topics table shows what subjects appeared most in graded conversations and which topics are driving the most bad grades.
| Column | What it shows |
|---|---|
| Topic | AI-generated topic label for the conversation (free-form, not a fixed enum) |
| Graded | How many graded conversations carried this topic in the period |
| Bad rate | Percentage of graded conversations with this topic that received a “bad” grade |
Topics with a non-zero bad rate are shown in red. A high bad rate on a specific topic (e.g. “billing”, “refund”) suggests a training or process problem in that area, not a random sample.
The table shows up to 12 topics, ranked by volume.
Email reports
If AI Auto-QA email delivery is not configured, a banner appears at the top of the tab offering to set it up. Daily quality report emails are sent from Settings - Reports when enabled.
Role access
Only organization owners and admins can view the Quality tab. The Quality tab also accepts the agent filter (top of the reports page), so admins can scope the view to a single agent’s conversations.
Was this article helpful?
Thanks for your feedback!