
 Reports & Analytics
Live Escalations Report
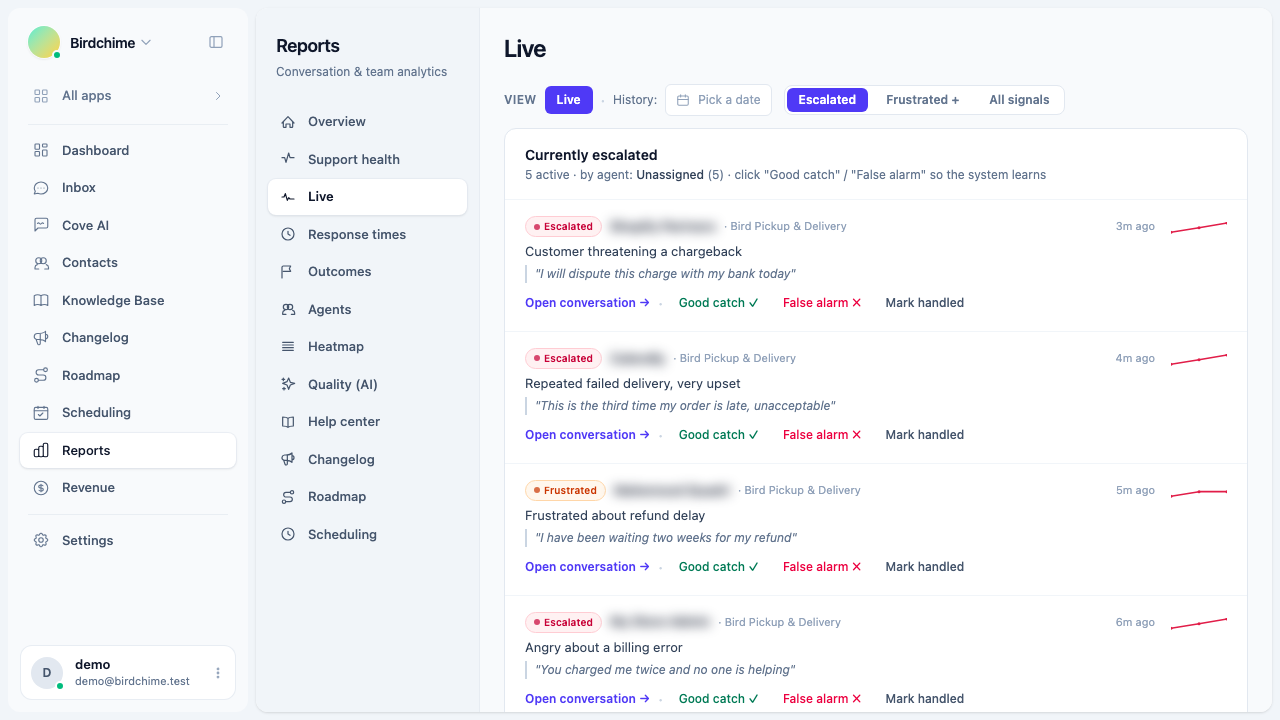
The Live tab shows real-time frustration escalations, the four frustration level tiers, a per-conversation trajectory, and the Good catch / False alarm feedback loop. Switch to history mode to review any past day.
The Live tab is at Reports - Live. It is the only report tab that shows real-time data - it does not use the date-range filter bar and polls the server every 30 seconds automatically.
What an escalation is
Convot watches every incoming customer message for signs of frustration. When the system detects a pattern - harsh language, repeated complaints, or an escalating tone - it surfaces the conversation in the Live tab so a supervisor can intervene before the customer churns.
The detection runs in a three-stage cascade: a keyword lexicon, a sentiment classifier, and a language model that makes the final call. Each detected signal produces an entry in the Live tab.
Frustration level tiers
Each conversation in the list carries a level badge:
| Level | Label | Meaning |
|---|---|---|
| 0 | Calm | No frustration detected |
| 1 | Mild | Slight impatience or mild dissatisfaction (amber) |
| 2 | Frustrated | Clear frustration, the customer is unhappy (orange) |
| 3 | Escalated | Demands supervisor involvement, very strong language, or repeated unresolved complaints (red) |
Filtering by level
The pill selector above the list sets the minimum level shown:
- Escalated - level 3 only. The default. Shows only conversations where supervisor intervention is probably needed.
- Frustrated + - levels 2 and 3 (orange and red).
- All signals - levels 1, 2, and 3 (amber, orange, red).
Use “All signals” if you want early warning, or if you are tuning the system and want to see everything it is catching.
The conversation list
Each row shows:
- Level badge (color-coded as above)
- Customer name and the app the conversation belongs to
- Which agent is currently handling it
- When the signal was detected (“3m ago”, “1h ago”, etc.)
- The reason the system flagged it - a short plain-English sentence
- A quoted excerpt from the customer’s message that triggered the flag
- A mini trajectory chart (see below)
Trajectory
The small line chart on the right of each row plots the frustration level history for that conversation over its most recent readings. A flat line means the frustration has held steady; a rising line means it is getting worse.
Actions on a live escalation
Three actions are available on each live row:
Open conversation - jumps directly to the conversation in the inbox so you can read the full thread and reply.
Good catch - tells the system the flag was correct. The model uses this feedback to improve future precision.
False alarm - tells the system the flag was incorrect. The model uses this feedback to reduce false positives.
Mark handled - removes the conversation from the live list, signaling that a supervisor has reviewed it and it no longer needs attention. Only available in live mode (not history).
Marking “False alarm” on a conversation you still want to watch will remove the escalation flag. Only use it when the system was genuinely wrong, not just when the situation has resolved.
History mode
By default the tab is in live mode, showing escalations right now. To review a past day, click the History date picker and choose a date. The tab switches to a snapshot of that day’s escalations, filtered to the selected level.
In history mode:
- The list shows all escalations detected on that day, including ones that were already marked handled.
- “Mark handled” is not available (the event is in the past).
- The tab title changes to confirm you are viewing a historical snapshot.
- A roll-up line shows how many escalations occurred per agent on that day.
To return to live mode, click the Live button next to the date picker.
Role access
Only organization owners and admins can view Reports. Agents are redirected to the inbox if they navigate to the Live tab directly.
Was this article helpful?
Thanks for your feedback!