
 Reports & Analytics
Support Health Report
The Support health tab shows resolved, pending, and escalated counts, the AI-generated category breakdown of what is driving support, and an engineering escalation scorecard with time-to-ack, time-to-answer, time-to-fix, and per-owner accountability.
The Support health tab is at Reports - Support health. It answers two questions: what type of issues are your customers sending, and how quickly is engineering unblocking your team when they get escalated.
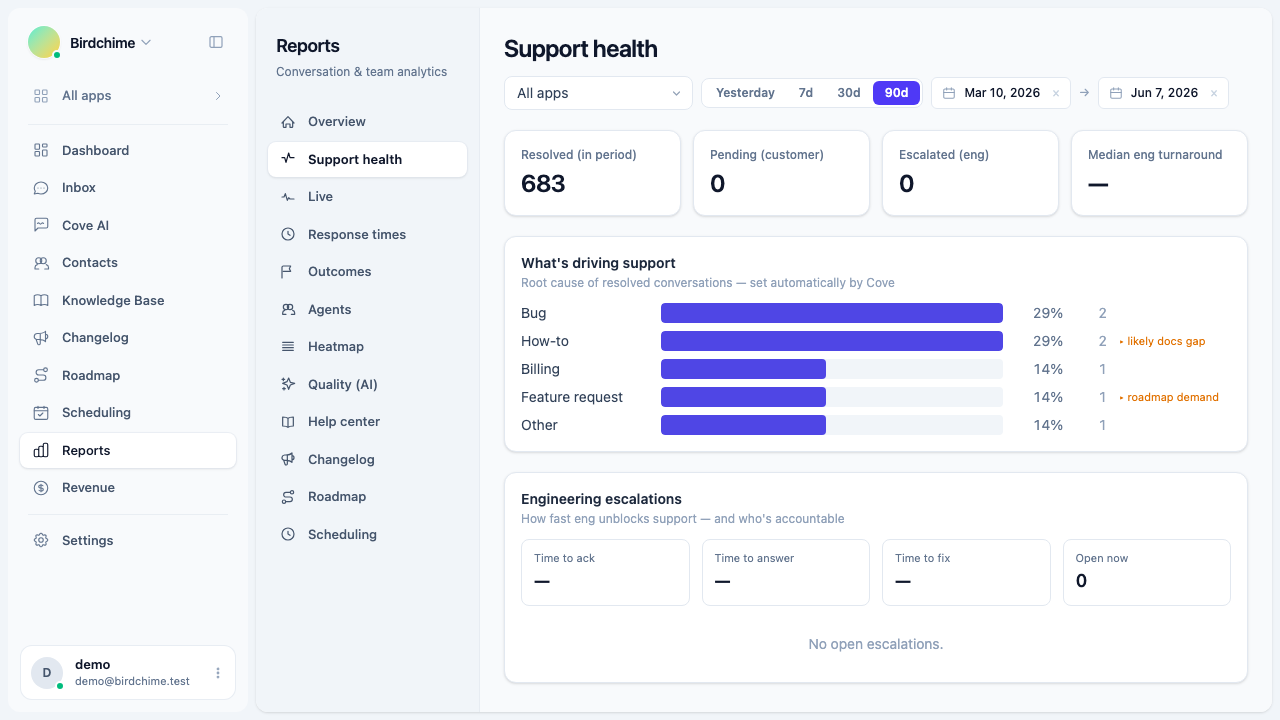
The four headline stats
At the top of the page, four stat cards give you a snapshot of the current period.
| Stat | What it measures |
|---|---|
| Resolved (in period) | Conversations that moved to “resolved” status within the selected date range |
| Pending (customer) | Open conversations currently waiting on the customer, with no active engineering escalation |
| Escalated (eng) | Conversations that have an open engineering escalation right now |
| Median eng turnaround | Median time from escalation created to escalation resolved, for escalations closed in this period |
What’s driving support
The “What’s driving support” card shows a horizontal bar chart of root-cause categories for all resolved conversations in the period.
Categories are assigned automatically by Cove AI when a conversation is resolved and conversation summaries are enabled. If no conversations have been categorized yet, the card shows a prompt to enable summaries.
The six categories are:
| Category | Meaning |
|---|---|
| Bug | A product defect reported by the customer |
| How-to | A question about how something works |
| Feature request | A request for something the product does not yet do |
| Billing | A question or issue related to charges or payments |
| Education / marketing gap | The customer misunderstood what the product does or does not do |
| Other | Does not fit the categories above |
Each row shows the category name, a proportional bar, the percentage of resolved conversations, and the raw count. When a category carries a hint, it appears inline: “likely docs gap” on How-to, “roadmap demand” on Feature request, and “messaging gap” on Education / marketing gap. These hints tell you the likely next action.
The categories only populate once conversation summaries are turned on. You can enable them in Settings - AI. Resolved conversations before that point will not be back-filled.
Engineering escalations scorecard
The escalations scorecard tracks how fast your engineering team responds to issues raised by support.
Scorecard metrics
| Metric | What it measures |
|---|---|
| Time to ack | Median time from escalation created to the first acknowledgement by an engineer |
| Time to answer | Median time from escalation created to resolution, for escalations of type “eng answer” |
| Time to fix | Median time from escalation created to resolution, for escalations of type “eng bug” |
| Open now | Number of escalations currently open (not resolved), across all dates |
Times are shown as hours (e.g. “4 h”) for durations under 24 hours, and as days (e.g. “1.5 d”) for longer durations.
SLA breaches
If any open escalations have exceeded their SLA, a warning line appears above the owner table:
Warning: N SLA breach(es)
The “Open now” stat card also turns red when there are active breaches.
Per-owner breakdown
Below the scorecard metrics, a table lists the engineers who currently own open escalations:
| Column | What it shows |
|---|---|
| Owner | Engineer’s display name or email |
| Open | Number of open escalations owned by this person |
| Oldest | How long ago the oldest open escalation was created |
| Breached | Whether any of their open escalations have exceeded the SLA |
The table is sorted by open count descending, so the most-loaded engineer is always at the top.
Filters
The Support health report respects the app filter at the top of the reports page. Selecting a specific app scopes all stats, categories, and escalation data to that app’s conversations.
The date range applies to resolved counts, categories, and the median eng turnaround. The “Open now” and “Escalated (eng)” counts are always live snapshots, not date-scoped.
Role access
Only organization owners and admins can view Reports. See role access for details.
Was this article helpful?
Thanks for your feedback!