
 Status Page
Setting Up Status Components
Status components are the individual services on your status page - add one for each part of your product (API, Dashboard, Widget) and set their health status.
Status components are the rows on your status page - each one represents a part of your product. Visitors see each component’s current health and its 90-day uptime bar.
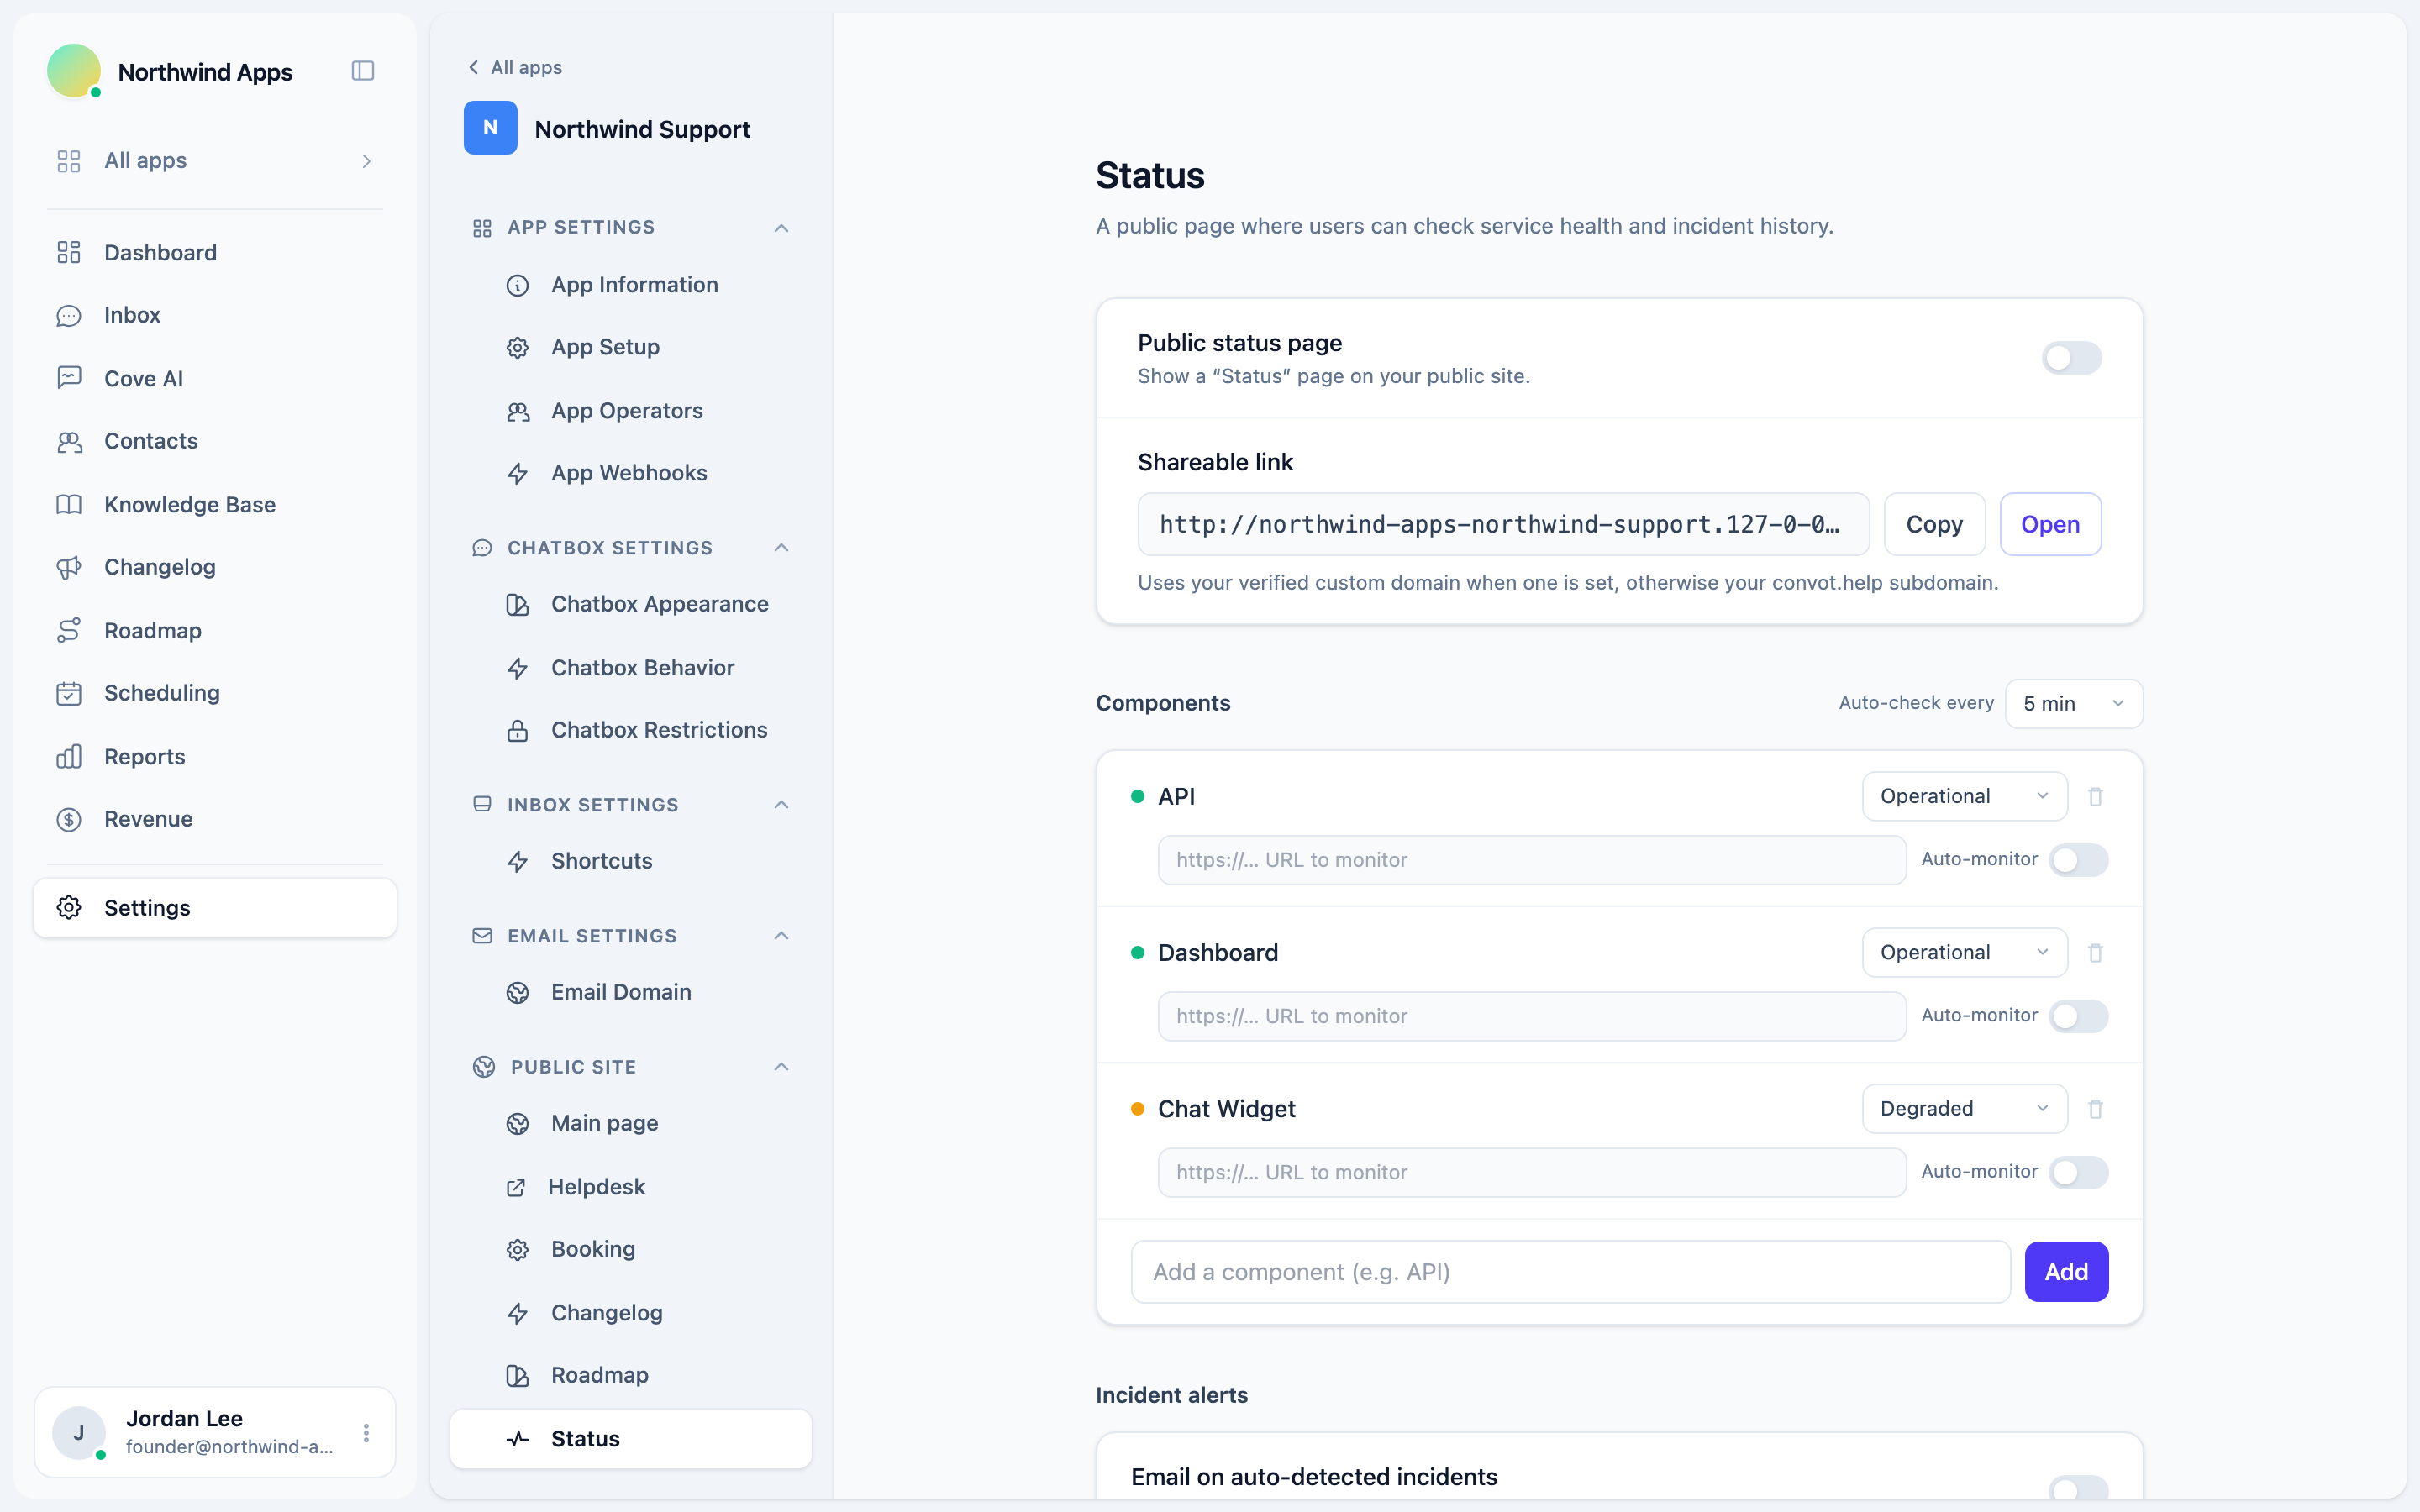
Enabling the status page
The status page is not enabled by default. To turn it on:
- Go to Settings → Apps → [your app] → Status.
- Toggle on Public status page.
- The status page is now live at the URL shown on that page.
Your status page URL uses your convot.help subdomain by default, or your custom domain if you’ve set one up.
Adding components
Components are the services you want to report health for - for example: API, Dashboard, Widget, Database, or CDN.
- In the Components section of the Status admin page, type a component name in the “Add a component” input (e.g. “API”).
- Press Enter or click Add.
- The component appears in the list with status Operational.
Component statuses
Each component has one of five statuses:
| Status | Color | Meaning |
|---|---|---|
| Operational | Green | Everything is working normally. |
| Degraded | Amber | Performance is slower than usual but functional. |
| Partial outage | Orange | Some users or requests are affected. |
| Major outage | Red | The service is down or broadly broken. |
| Maintenance | Blue | Scheduled downtime or planned work. |
To change a component’s status, click the status dropdown on its row and pick the new status.
Uptime monitoring
Each component can be set to automatically monitor a URL. Convot pings the URL every few minutes and records whether it responds successfully.
To configure monitoring on a component:
- Click the component row to expand it.
- Enter the Monitor URL - a publicly reachable HTTPS endpoint (e.g.
https://api.yourapp.com/health). - Enable Auto-check.
- Save.
Convot records each check result. The component’s uptime bar on the public page shows the last 90 days as color-coded daily segments.
You can adjust how often checks run using the Auto-check every dropdown (2, 5, 10, 15, or 30 minutes) at the top of the Components section.
Monitor URLs must be HTTPS and respond to GET requests. If the URL requires authentication, create a dedicated health-check endpoint that doesn’t.
Reordering components
Drag components to reorder them on the status page. The order here matches what customers see.
Deleting a component
Click the trash icon on the component row. This permanently removes the component and its check history. Active incidents that referenced this component remain - they just won’t list it under “Affects”.
The overall page banner
The banner at the top of the public status page shows the worst-case status across all your components. If every component is operational, the banner reads “All systems operational” in green. One major outage makes the whole banner red.
Next steps
Was this article helpful?
Thanks for your feedback!