
 Reports & Analytics
Outcomes Report
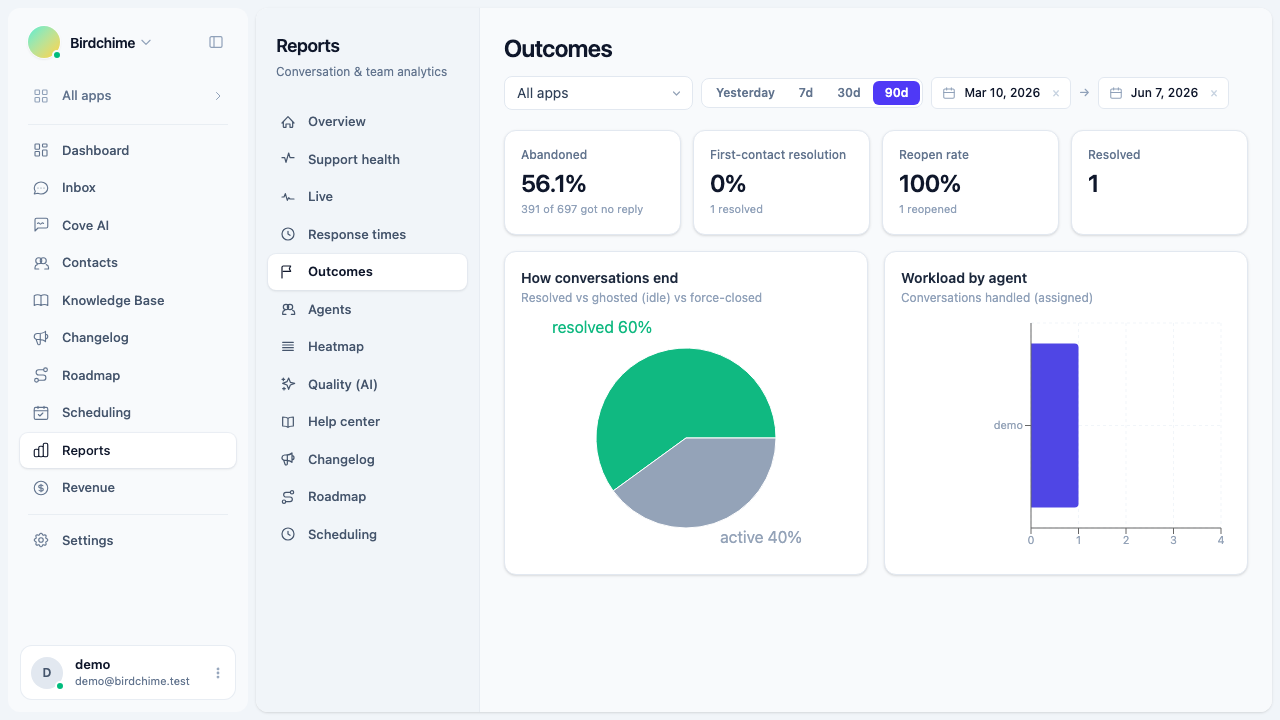
The Outcomes tab shows abandoned rate, first-contact resolution, reopen rate, a breakdown of how conversations end (resolved, idle timeout, force closed), and workload distribution by agent.
The Outcomes tab is at Reports - Outcomes. It measures the quality and completeness of your support conversations: whether customers got a reply, whether resolved conversations stayed resolved, and how load is distributed across agents.
The four headline stats
| Stat | What it measures |
|---|---|
| Abandoned | Percentage of conversations where a customer sent at least one message but received no agent reply |
| First-contact resolution (FCR) | Percentage of resolved conversations that were resolved without being reopened - the “fixed it first time” rate |
| Reopen rate | Percentage of resolved conversations that were reopened (the customer or agent re-engaged after resolution) |
| Resolved | Total conversations resolved in the period |
The Abandoned card also shows the raw count: “N of M got no reply”. The FCR and Reopen rate cards show the resolved count alongside the percentage.
FCR and Reopen rate are complementary: FCR = 100% minus Reopen rate. A high FCR means your team is solving problems completely on the first pass.
How conversations end
The pie chart breaks down sessions started in the period by their ended_reason. The four segments are:
| Reason | What it means |
|---|---|
| resolved | A session that ended because the conversation was marked resolved by an agent |
| idle_timeout | A session that ended because the customer stopped responding and the conversation timed out automatically |
| force_closed | A session that ended because an agent closed the conversation without a formal resolution |
| active | Sessions that were started in the period and are still open (not yet ended) |
Each segment shows its percentage. Hover over a segment for the raw count.
A healthy inbox has a high “resolved” share and a low “idle_timeout” share. A large “force_closed” segment may mean agents are closing conversations to clear the queue rather than truly solving the issue. A large “active” segment can mean conversations are stacking up without resolution.
Workload by agent
The horizontal bar chart shows how many conversations each agent handled in the period. “Handled” means the conversation was assigned to that agent at some point during the period.
This chart helps you spot imbalances - if one agent is carrying dramatically more volume than others, it may be a routing issue or a staffing gap.
The chart is filtered by the assignee filter when you are on the Outcomes tab. Selecting a specific agent shows only that agent’s conversations in the stats above (Abandoned, FCR, Reopen) as well as in the workload chart.
Date range and filters
All Outcomes metrics are scoped to conversations created within the selected date range. The workload chart uses the same scope.
The app filter at the top of the page narrows the report to conversations from that app.
The Abandoned calculation counts conversations where a customer message exists but zero agent messages exist. Bot replies from Cove AI do not count as agent replies for this metric - a conversation handled entirely by the bot appears as abandoned in this report.
Role access
Only organization owners and admins can view Reports. See role access for details.
Was this article helpful?
Thanks for your feedback!