
 Reports & Analytics
Changelog, Roadmap, and Scheduling Reports
Three reports in one article - Changelog covers entry views and widget card opens, Roadmap covers votes, submissions, the status funnel, and top items, and Scheduling covers bookings, upcoming, cancelled, cancellation rate, status breakdown, and top meeting types.
Convot includes separate report tabs for your changelog, roadmap, and scheduling features. Each tab is scoped to the selected date range and app filter unless noted otherwise.
Changelog report
Reports - Changelog
The changelog report tells you how many people are reading your product updates and whether they are discovering them through your public page or through the widget.
Headline stats
| Stat | What it measures |
|---|---|
| Entry views | Total views of individual changelog entries on the public changelog page |
| Widget card opens | Times a visitor opened a changelog entry card in the in-app widget |
Engagement chart
A line chart plots entry views and widget card opens per day over the selected period. The two lines are shown together so you can see which channel is driving engagement - customers actively opening the widget vs. visitors landing on your public changelog.
Top entries
A ranked bar list shows the most-viewed changelog entries in the period. Each entry shows its title and view count. The bar width is proportional to the top entry’s views, so relative performance is immediately visible.
Use top entries to understand which types of updates resonate most. Releases with high view counts are worth promoting further; releases with low counts may need better titles or more prominent announcement channels.
Roadmap report
Reports - Roadmap
The roadmap report measures community engagement with your public feature board: how many votes and new submissions came in, where items sit in your pipeline, and which specific requests have the most demand.
Headline stats
| Stat | What it measures |
|---|---|
| Votes | Total new votes cast on roadmap items during the period |
| New submissions | New roadmap items submitted (by customers or by your team) during the period |
Votes and submissions over time
A line chart shows votes and submissions per day over the selected period. A spike in submissions on a specific day may indicate a recent announcement, a social post, or a support issue that triggered feedback.
Status funnel
A horizontal bar chart shows how many roadmap items are currently in each status stage. Unlike most data on this tab, the status funnel is a live snapshot of your pipeline, not a date-scoped view. It shows total item counts per status at the moment you load the page.
Each bar is colored with the status’s configured color (statuses and their colors are set in Settings - Roadmap). This gives you a quick read on whether items are progressing through your pipeline or accumulating in early stages.
Most requested
A ranked bar list shows the top 10 roadmap items by total vote count, all-time (not scoped to the date range). This is your definitive “most wanted” list.
Use this to prioritize your roadmap. Items near the top with no progress movement may be creating silent frustration in your user base.
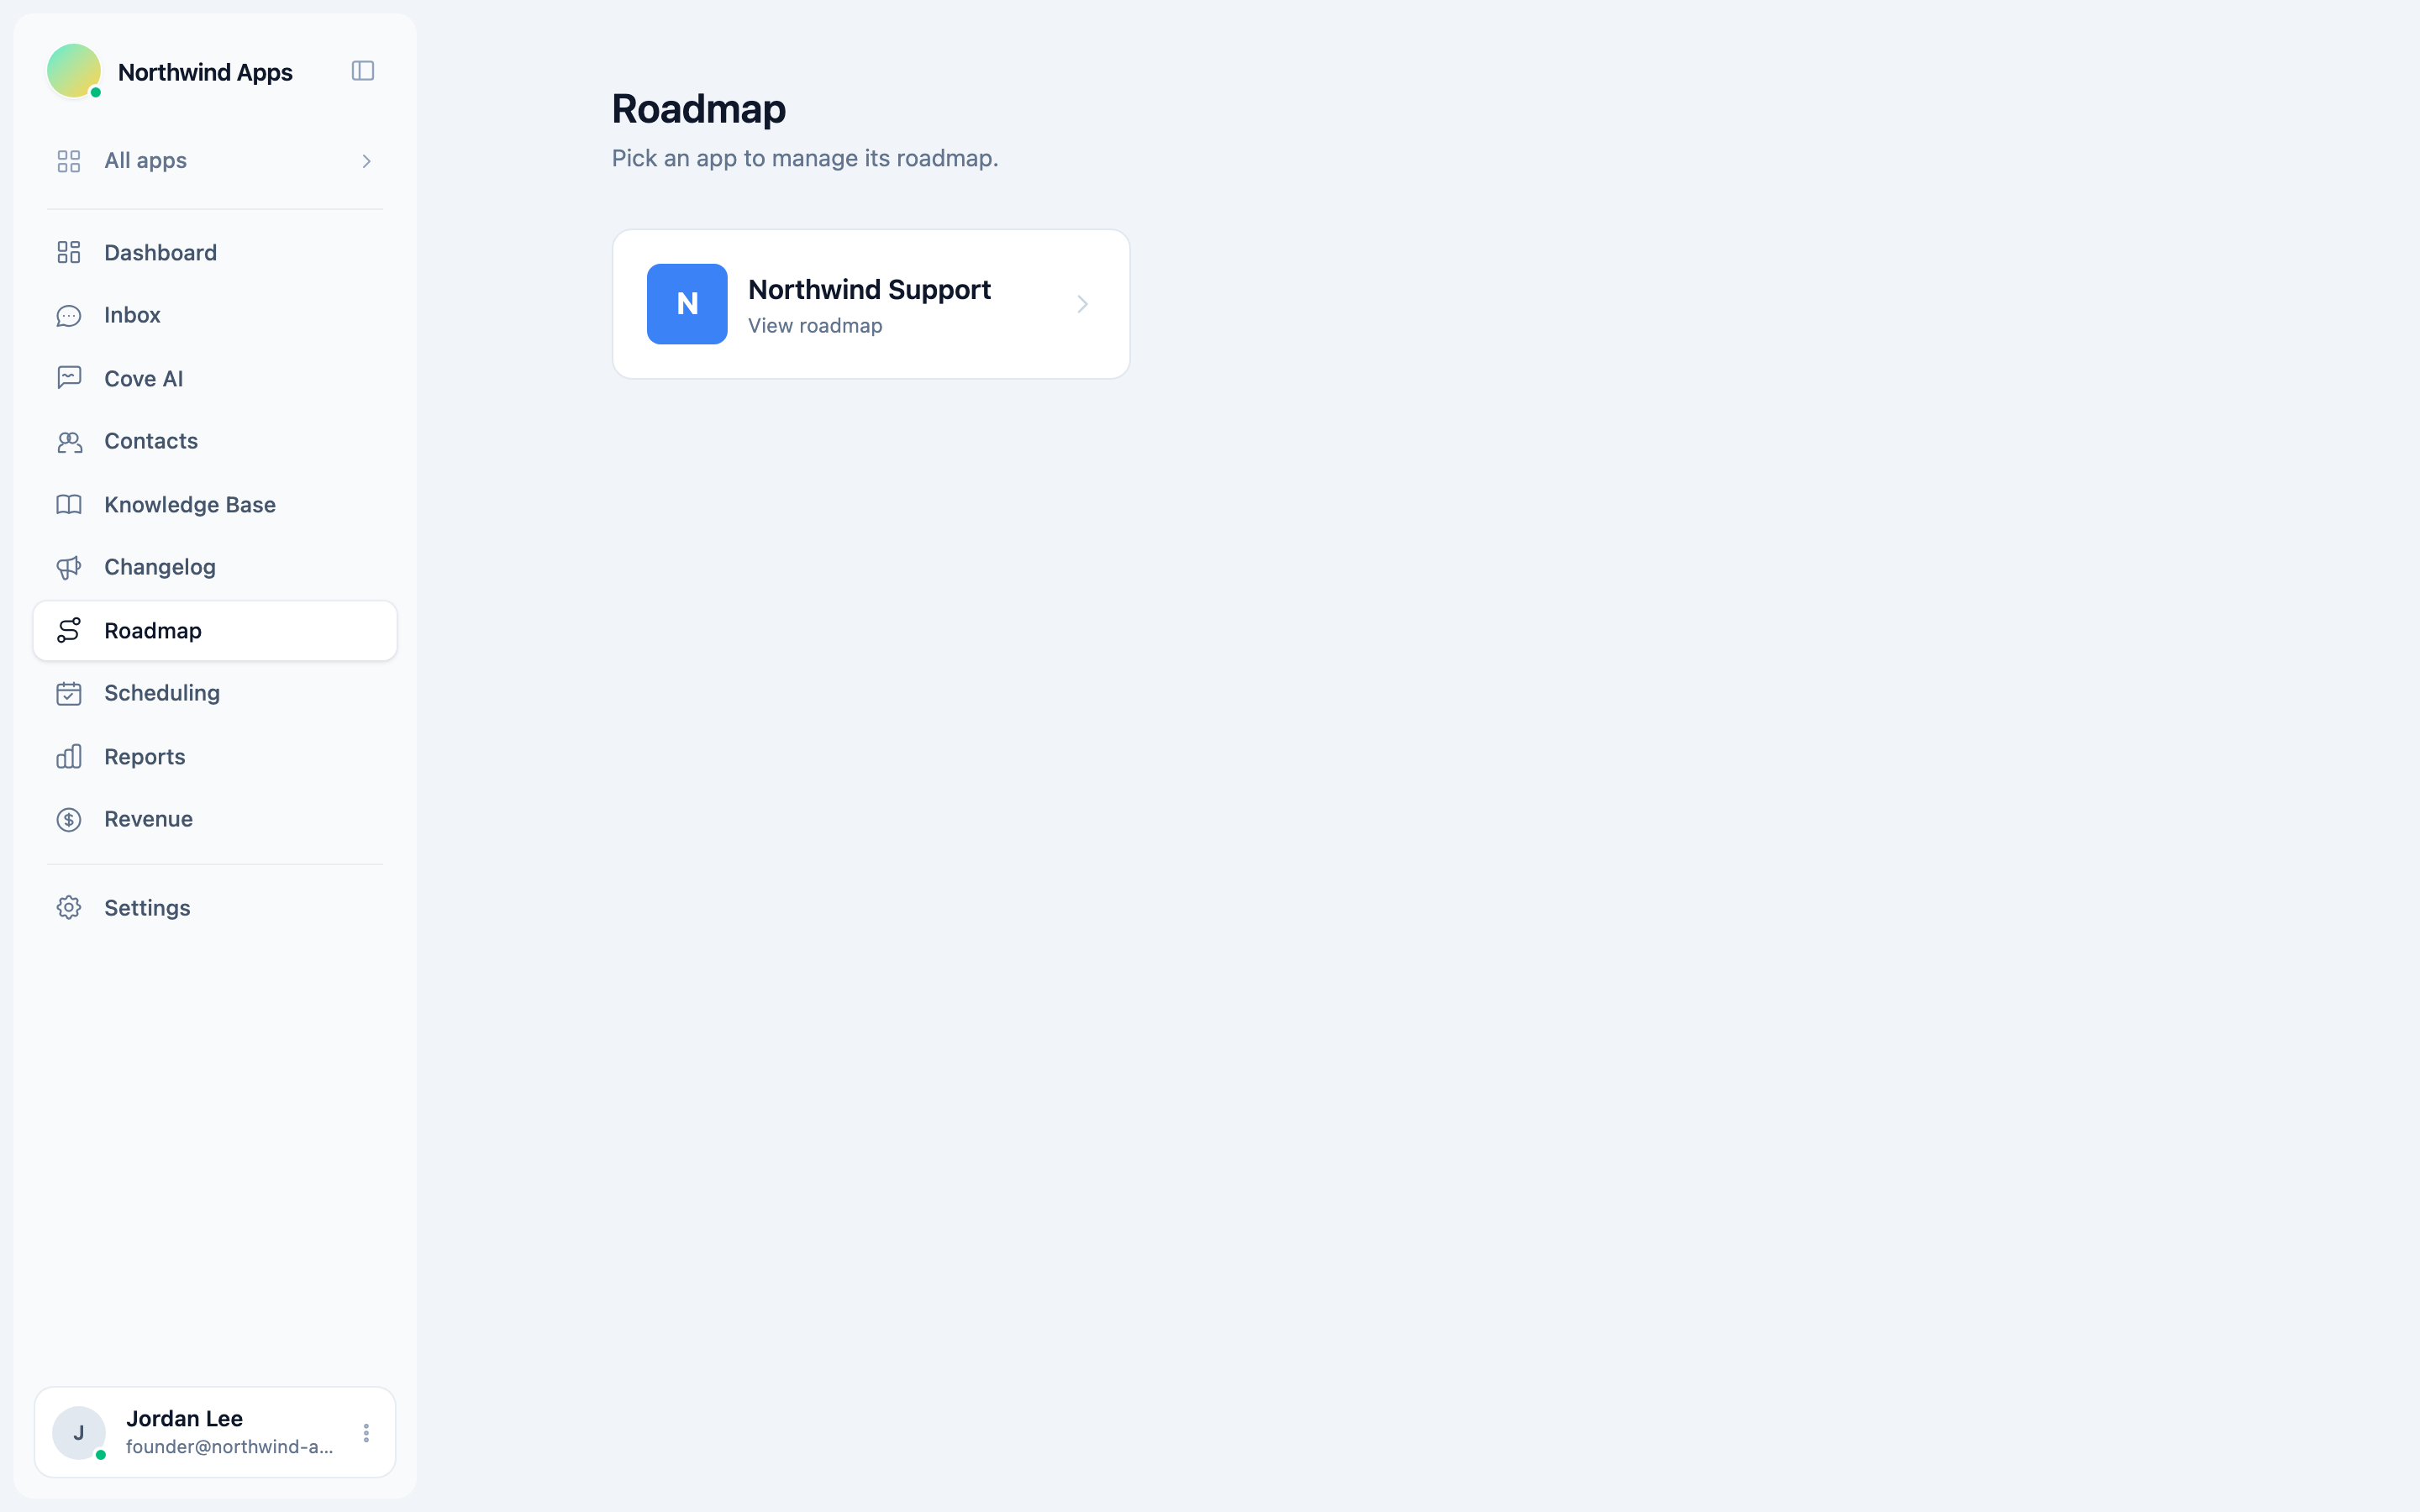
Scheduling report
Reports - Scheduling
The scheduling report covers booking activity. Note that scheduling is org-scoped, not app-scoped: the report shows all bookings across your organization for the selected period.
Headline stats
| Stat | What it measures |
|---|---|
| Bookings | Total bookings created in the selected period |
| Upcoming | Bookings with “confirmed” or “rescheduled” status that have a future start time (not date-scoped, always live) |
| Cancelled | Bookings cancelled in the selected period |
| Cancellation rate | Cancelled bookings as a percentage of total bookings in the period |
The Upcoming count is always a live number regardless of the date range picker, because it reflects future appointments.
Bookings over time
A bar chart shows new bookings created per day over the selected period. Spikes may correspond to product launches, pricing changes, or outreach campaigns.
By status
A breakdown of bookings created in the period by their status at report time:
| Status | Meaning |
|---|---|
| Confirmed | Customer booked and the booking has not been changed or cancelled |
| Rescheduled | Booking was moved to a new time after the original booking |
| Cancelled | Booking was cancelled by the customer or host |
Top meeting types
A ranked list of meeting types by booking count in the period. Each type shows its name and a proportional bar. Meeting types are defined in Scheduling - Meeting types.
If a meeting type was deleted after bookings were recorded for it, those bookings appear under “Deleted meeting type” in this list.
A high cancellation rate (above 20%) may indicate friction in the booking flow, meeting types with unsuitable durations, or time zones that are not matching your customers’ availability.
Role access
All three tabs - Changelog, Roadmap, and Scheduling - are visible only to organization owners and admins. See role access for details.
Was this article helpful?
Thanks for your feedback!